> ## Documentation Index
> Fetch the complete documentation index at: https://user-docs.seaticket.ai/llms.txt
> Use this file to discover all available pages before exploring further.
# Understanding the Analyze Interface
## Accessing Analyze Function
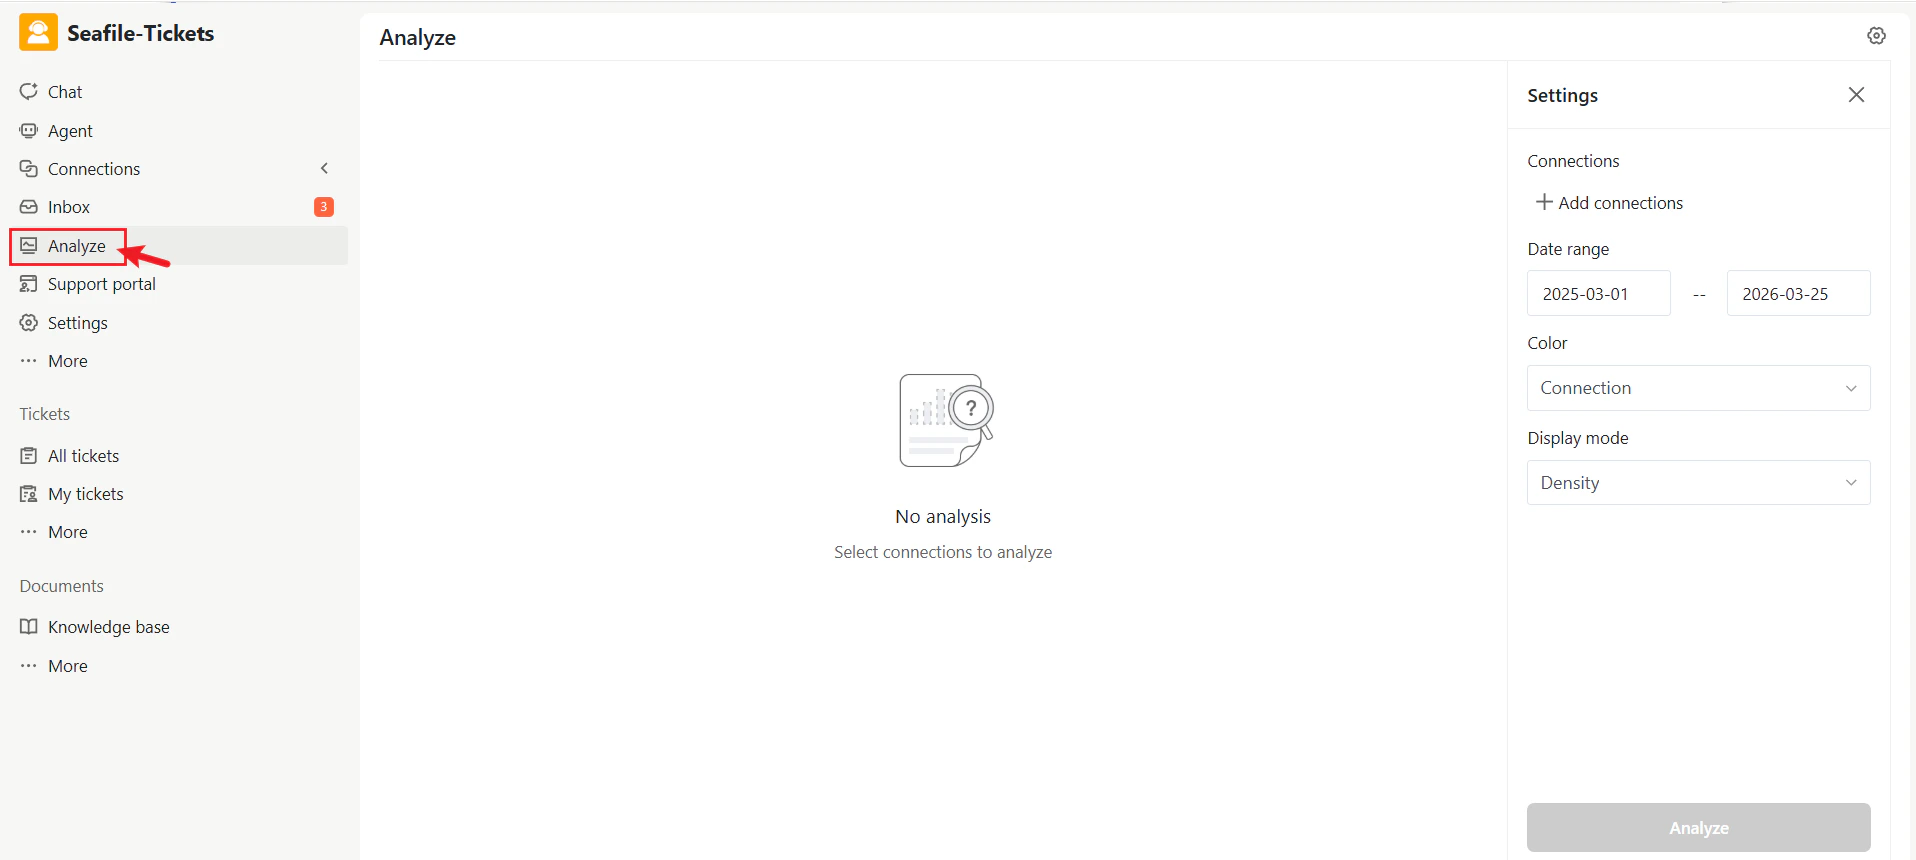
1. Open the project workspace.
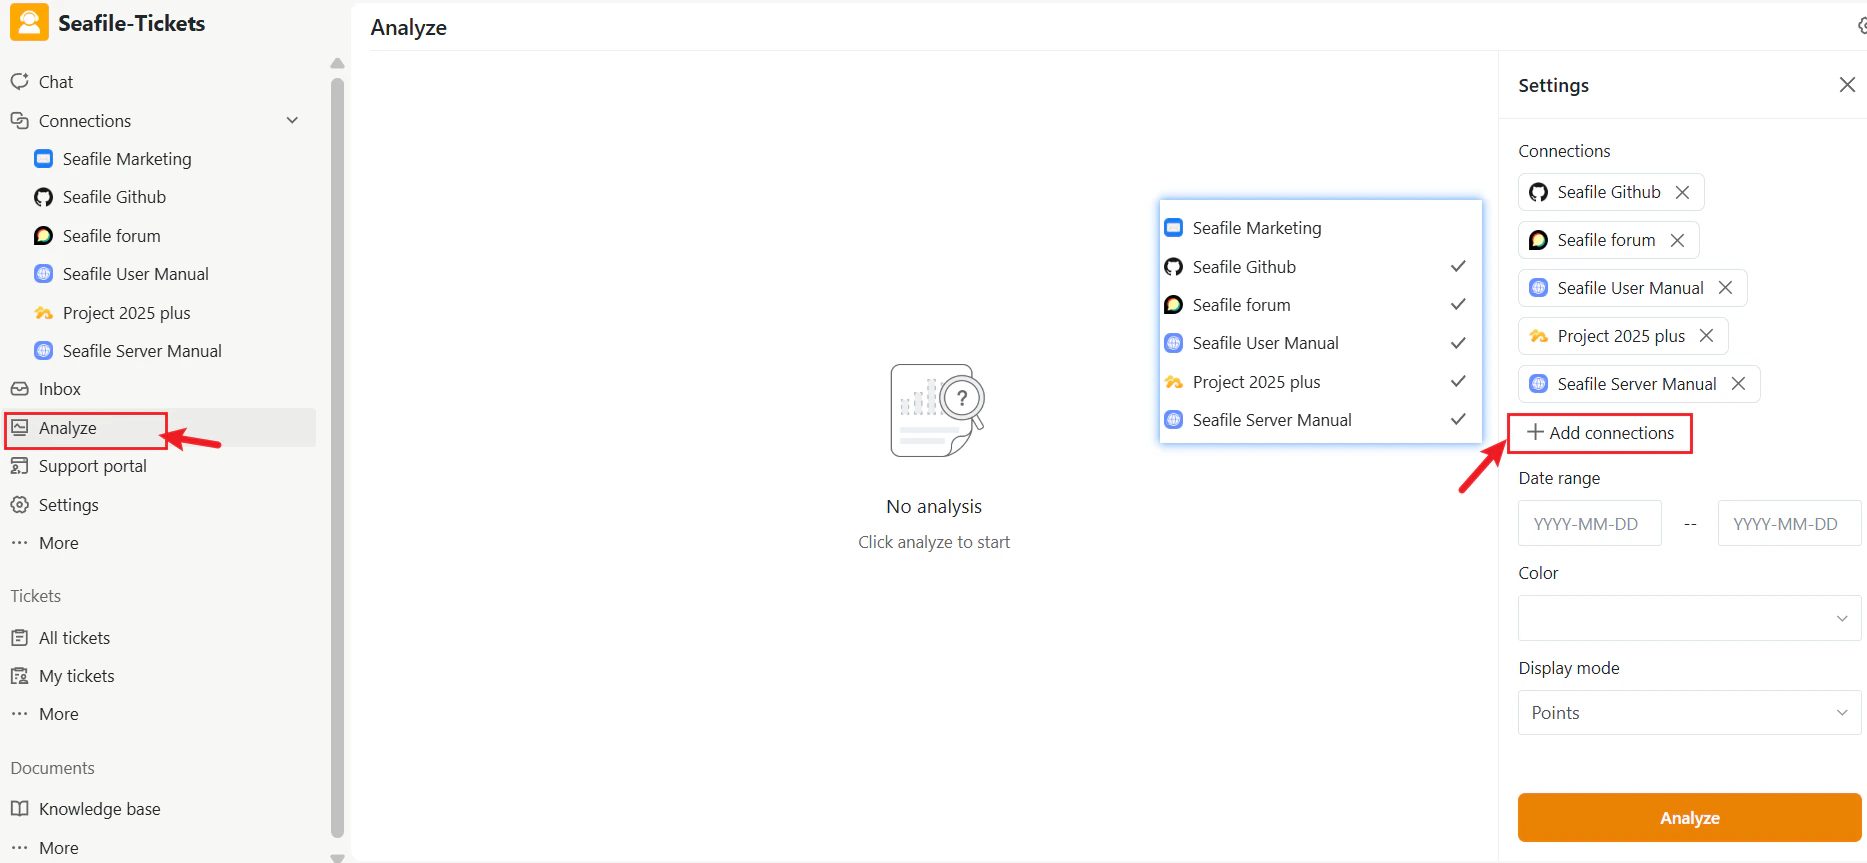
2. In the left navigation menu, click **Analyze**.
The **Analyze** page has two main sections:
* **Topic Map** (center) — displays dataset and topic clusters.
* **Settings panel** (right) — lets you filter and adjust how data appears
 ## Topic Map
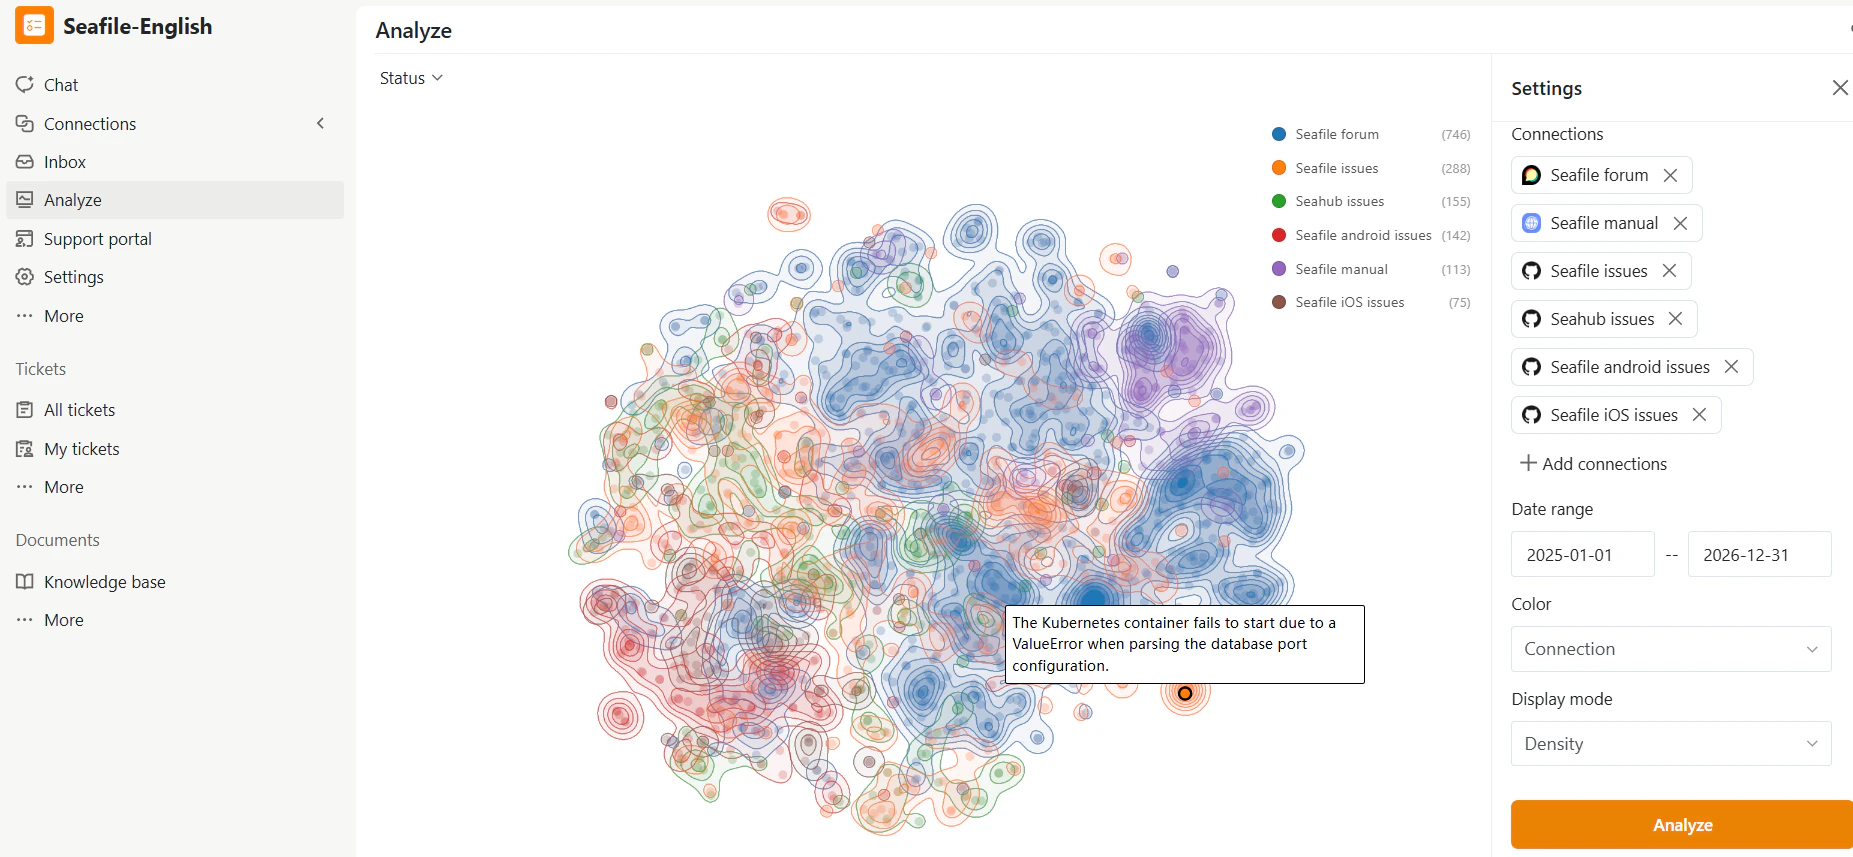
The topic map is the central visualization for exploring support conversations. Each item appears as a point on the map, with items of similar content clustered together.
**Display Modes**:
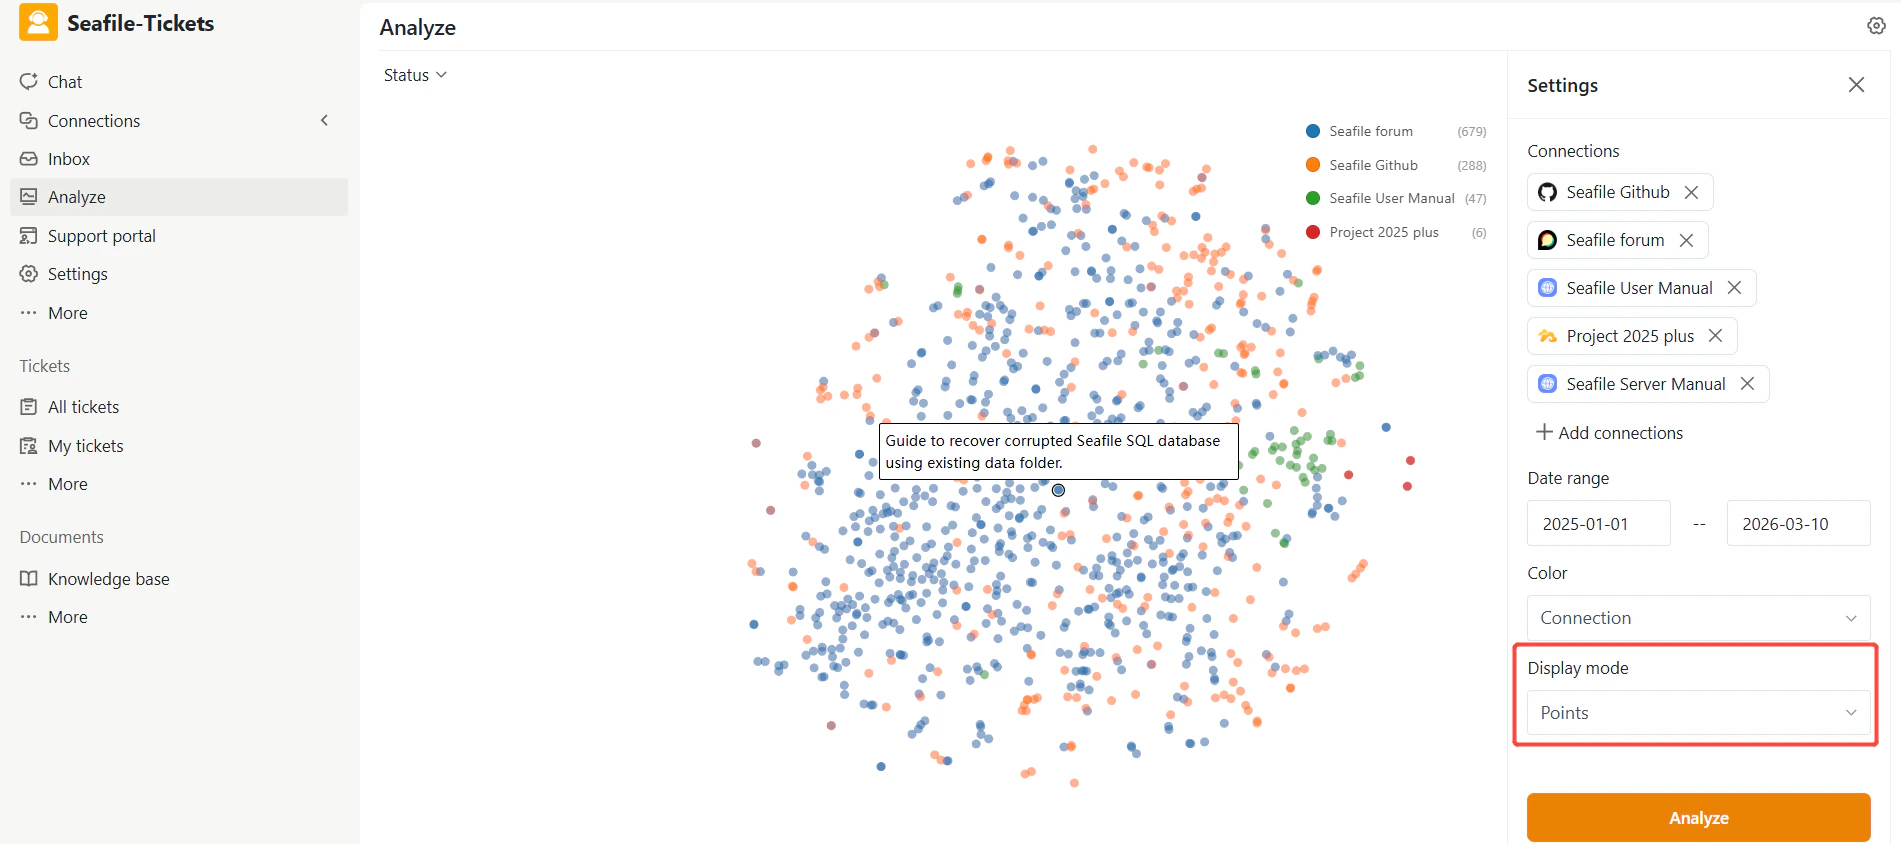
* **Points:** Displays each item individually for detailed inspection.
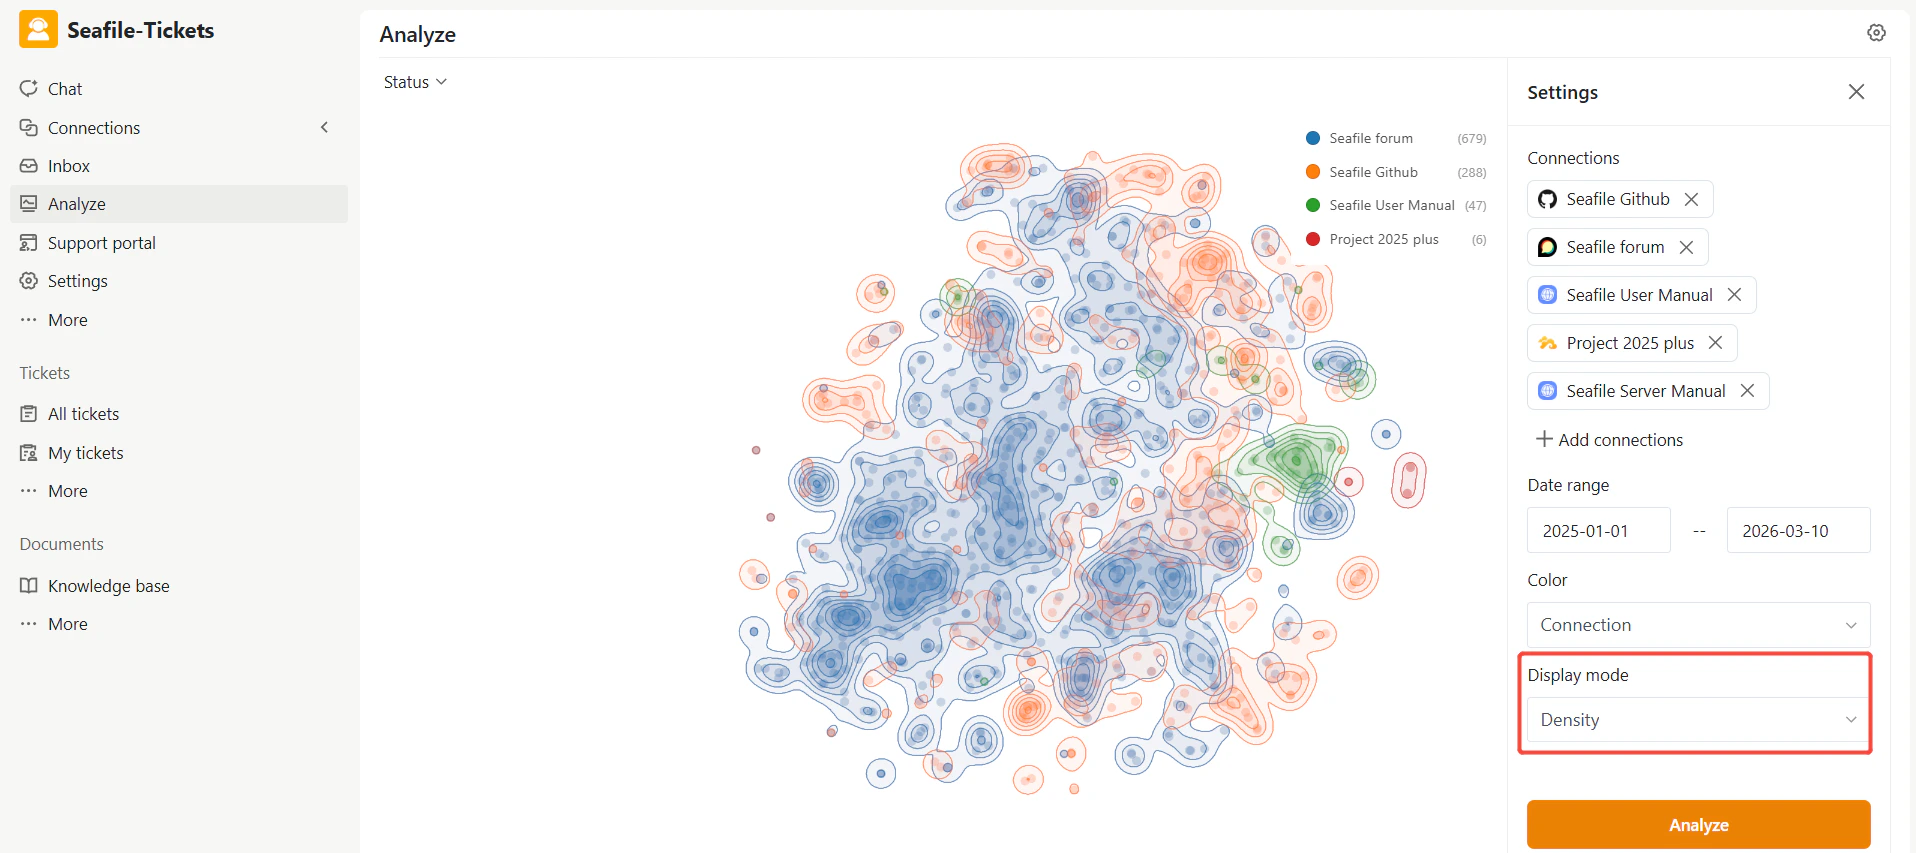
* **Density:** Uses a heatmap-style view to highlight areas with concentrated items.
Hover over any point to preview its content.
## Topic Map
The topic map is the central visualization for exploring support conversations. Each item appears as a point on the map, with items of similar content clustered together.
**Display Modes**:
* **Points:** Displays each item individually for detailed inspection.
* **Density:** Uses a heatmap-style view to highlight areas with concentrated items.
Hover over any point to preview its content.
 ## Settings Panel
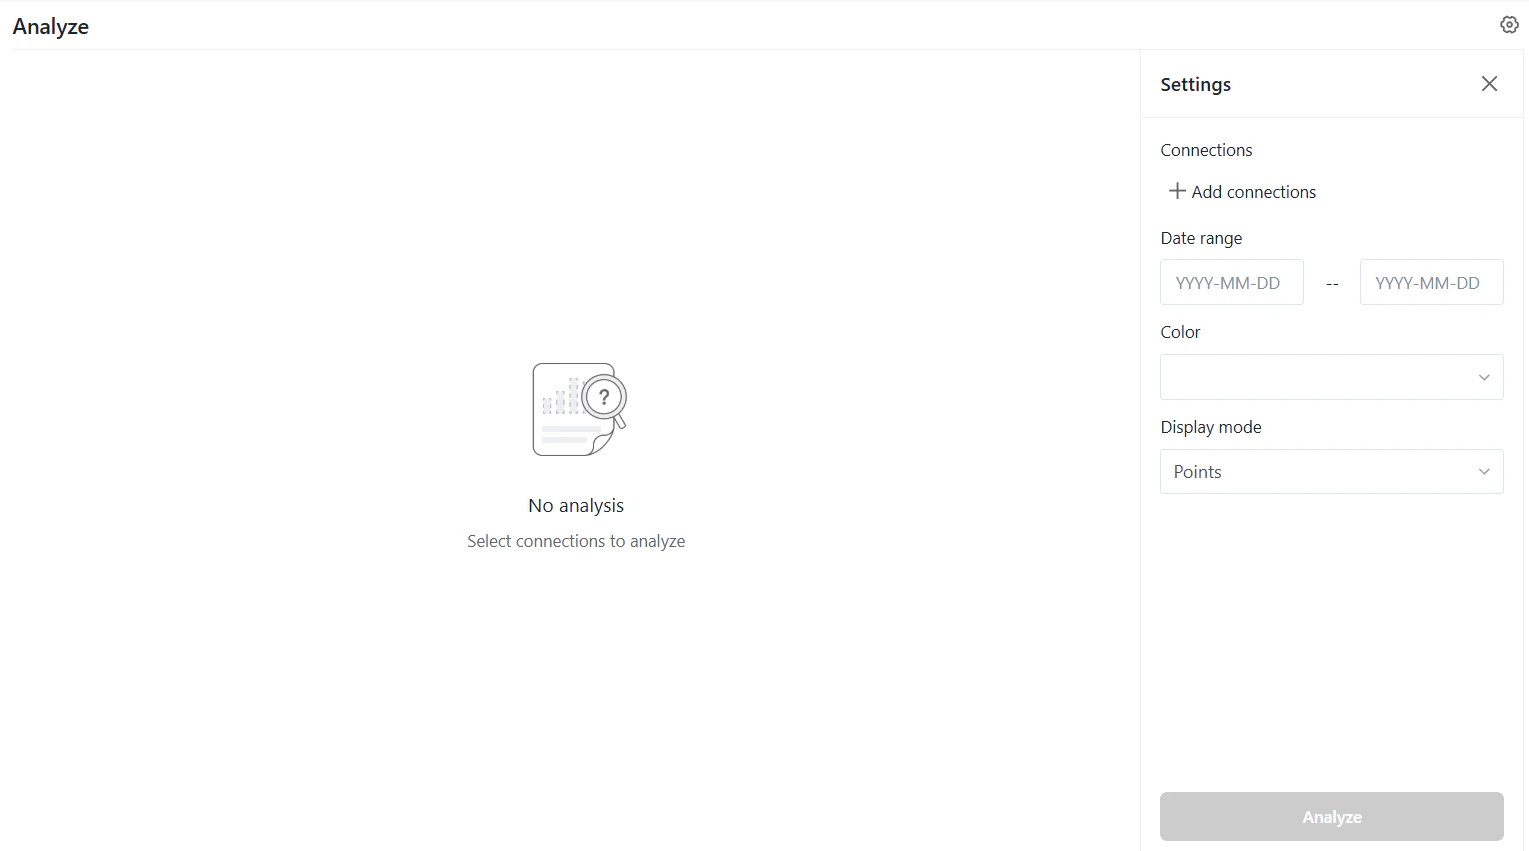
The **Settings Panel** allows you to configure which items appear and how they are displayed. Changes are applied after clicking **Analyze**.
## Settings Panel
The **Settings Panel** allows you to configure which items appear and how they are displayed. Changes are applied after clicking **Analyze**.
 ### Connections
Connections determine which sources are included in the analysis. Examples include:
* Forum discussions
* GitHub issues
* Product documentation
**To configure connections:**
1. Open the Connections section.
2. Select the sources you want to include.
3. Remove a source by clicking the × icon next to it.
4. Click **Add connections** to include additional sources.
### Connections
Connections determine which sources are included in the analysis. Examples include:
* Forum discussions
* GitHub issues
* Product documentation
**To configure connections:**
1. Open the Connections section.
2. Select the sources you want to include.
3. Remove a source by clicking the × icon next to it.
4. Click **Add connections** to include additional sources.
 ### Date Range
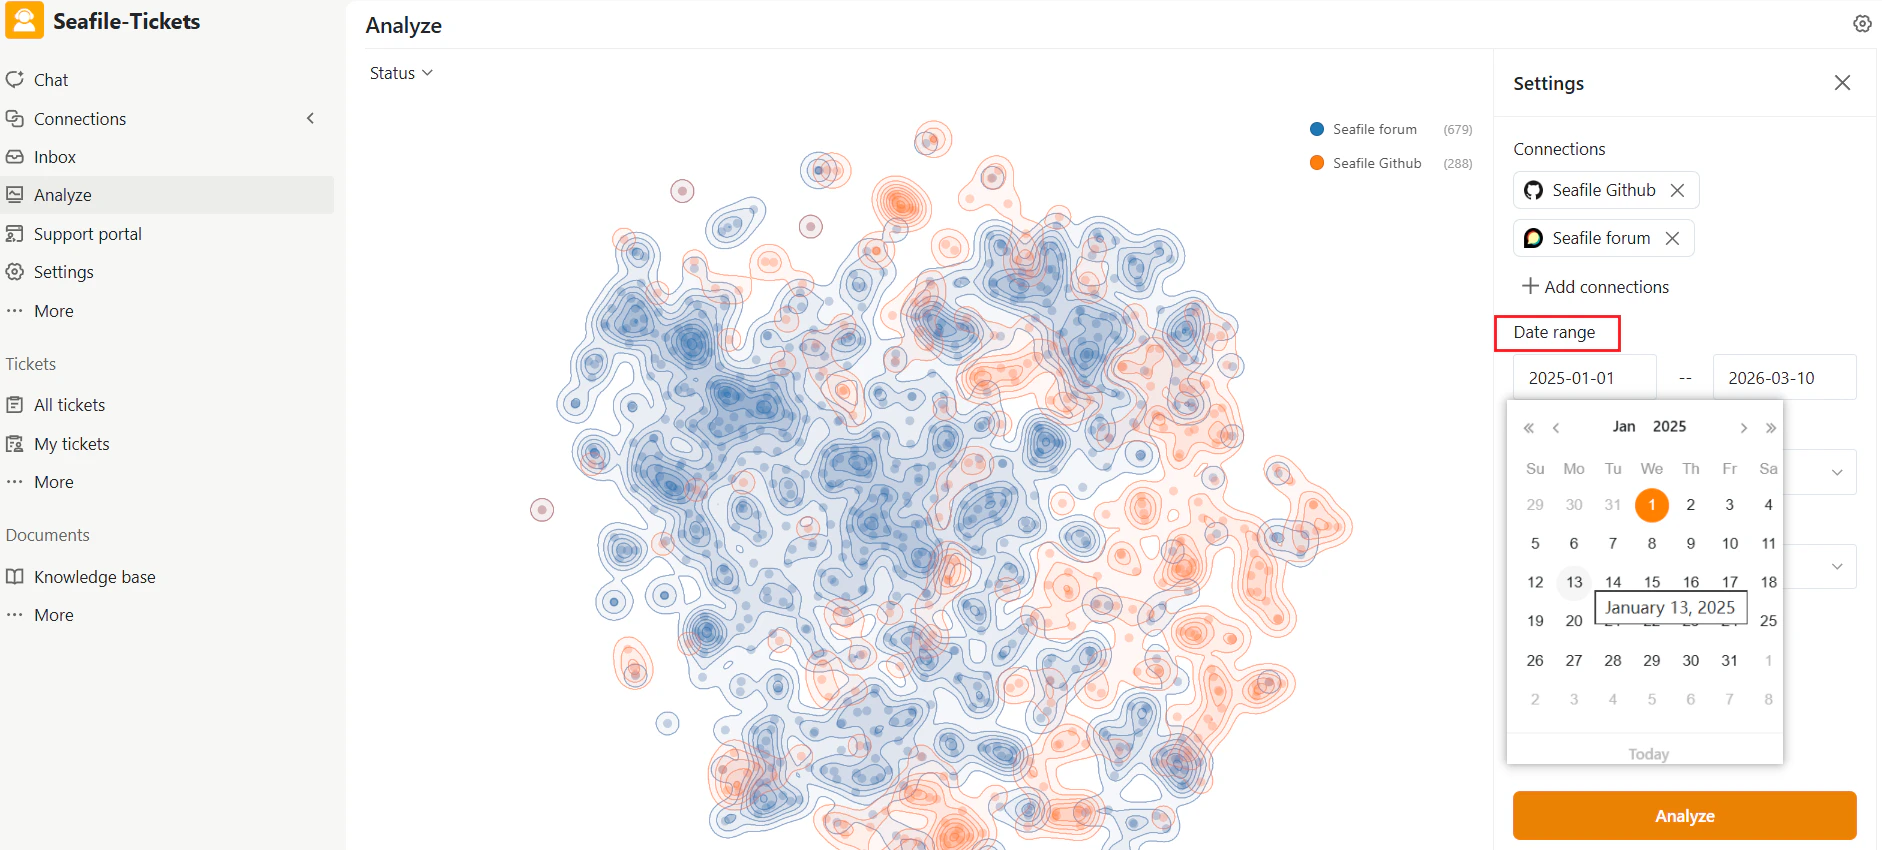
The **Date range** filter limits the analysis to items created within a specific period. Use this to:
* Analyze feedback for a particular release cycle
* Investigate recent support activity
Adjust the start and end dates, then click **Analyze** to refresh the visualization.
### Date Range
The **Date range** filter limits the analysis to items created within a specific period. Use this to:
* Analyze feedback for a particular release cycle
* Investigate recent support activity
Adjust the start and end dates, then click **Analyze** to refresh the visualization.
 ### Color
The **Color** option determines how items are visually grouped on the map. Common options include:
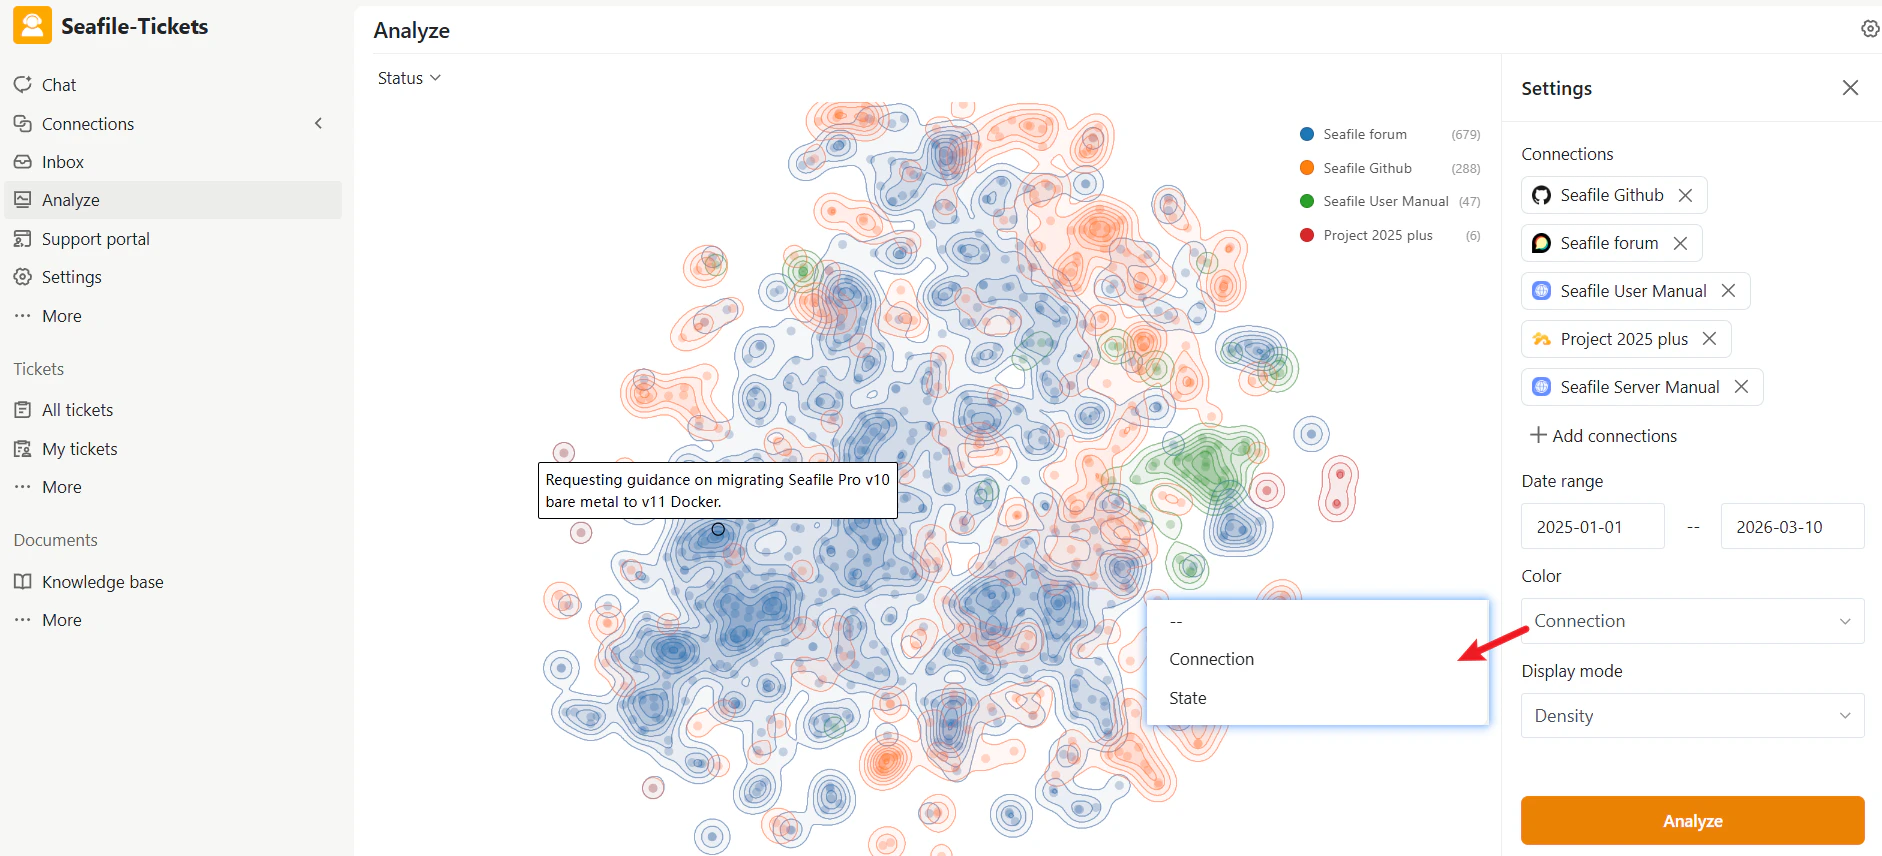
* **Connection** — Each data source appears in a different color, helping you see how topics are distributed across sources like forums and GitHub. Hovering over a point shows the title of that specific issue.
### Color
The **Color** option determines how items are visually grouped on the map. Common options include:
* **Connection** — Each data source appears in a different color, helping you see how topics are distributed across sources like forums and GitHub. Hovering over a point shows the title of that specific issue.
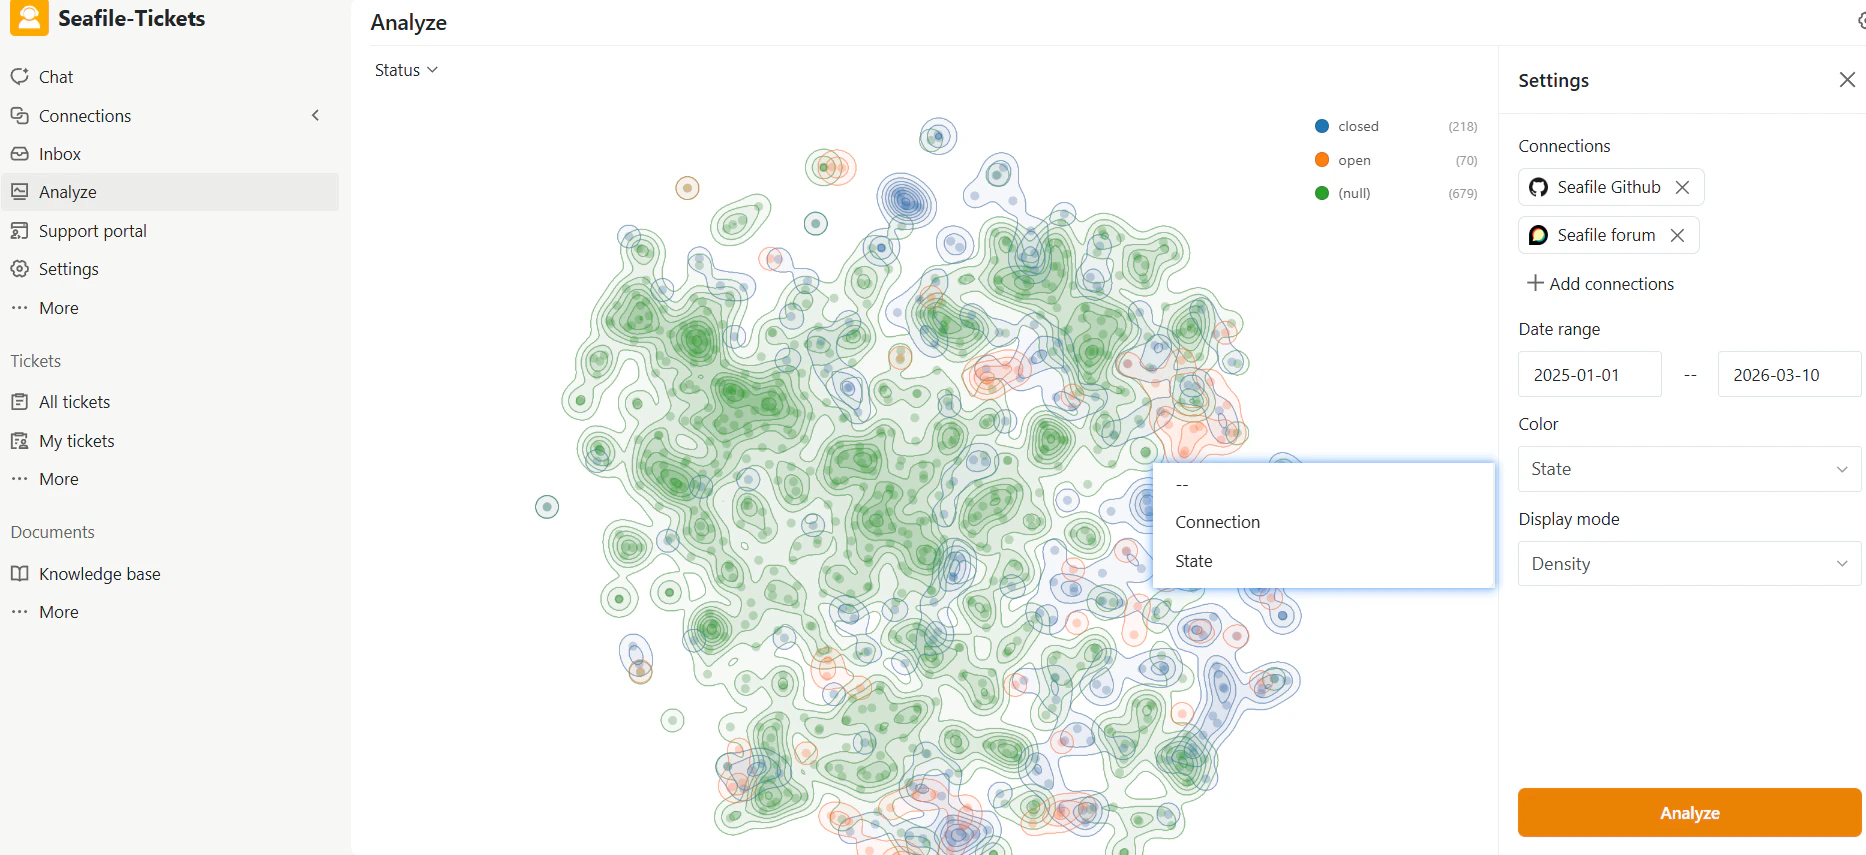
 * **State** — Items are colored by their status (Open, Closed, etc.), letting you quickly identify clusters of unresolved issues.
 ### Display Mode
The **Display mode** controls how the topic map renders. Two options are available:
* **Density** — Shows a heatmap-like visualization highlighting areas where many related items concentrate. Use this to quickly identify major topic clusters.
### Display Mode
The **Display mode** controls how the topic map renders. Two options are available:
* **Density** — Shows a heatmap-like visualization highlighting areas where many related items concentrate. Use this to quickly identify major topic clusters.
 * **Points** — Displays each item as an individual point. Use this when exploring specific issues or discussions.
 ### Status Filter
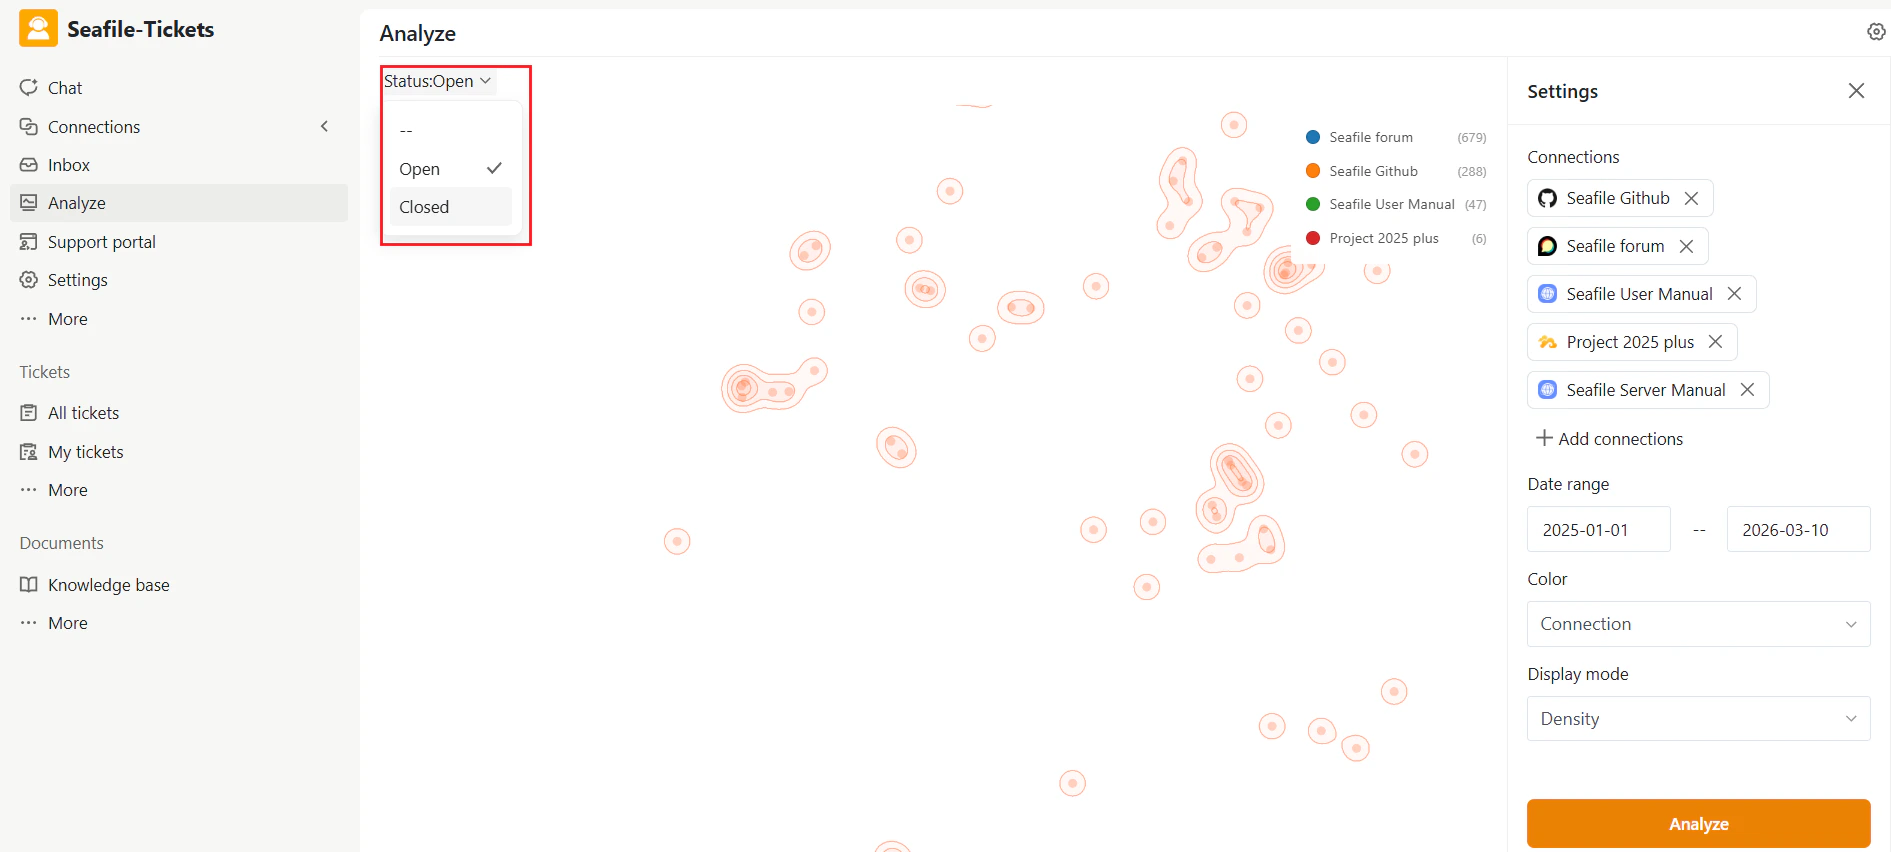
The **Status** filter at the top of the page lets you focus on items with a specific state. Available options typically include:
* **Open** — Items that are still unresolved
* **Closed** — Resolved or completed items
This filter is helpful when analyzing active problem areas.
### Status Filter
The **Status** filter at the top of the page lets you focus on items with a specific state. Available options typically include:
* **Open** — Items that are still unresolved
* **Closed** — Resolved or completed items
This filter is helpful when analyzing active problem areas.